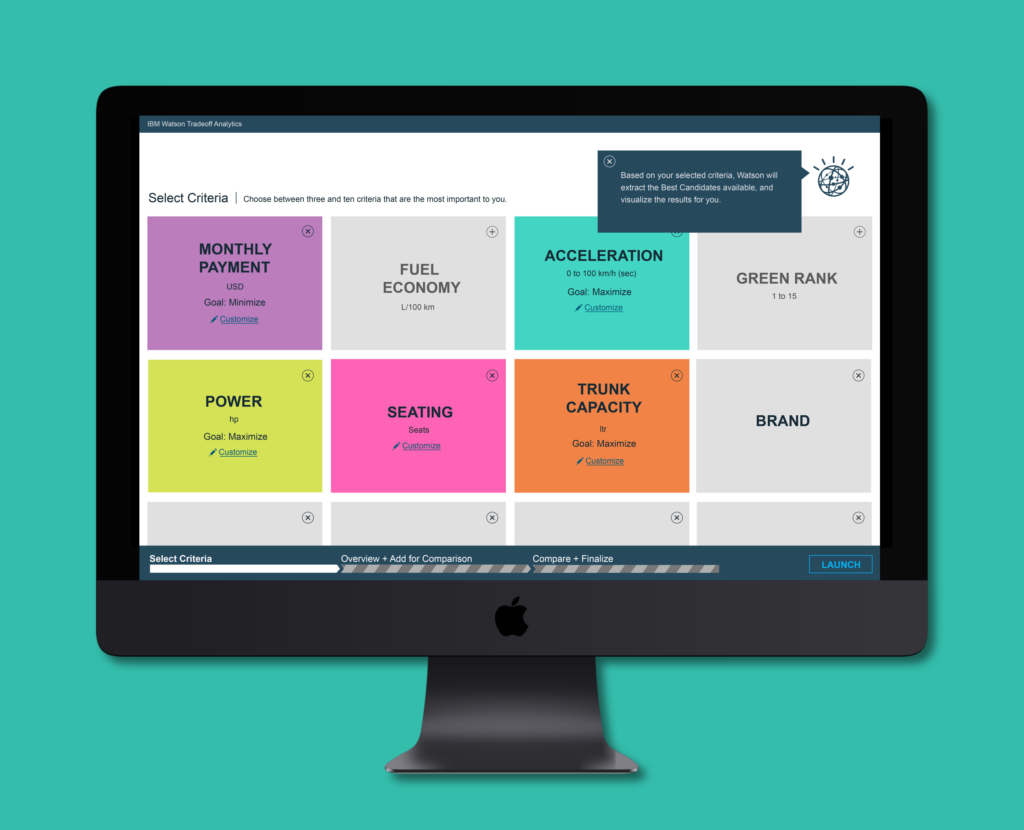
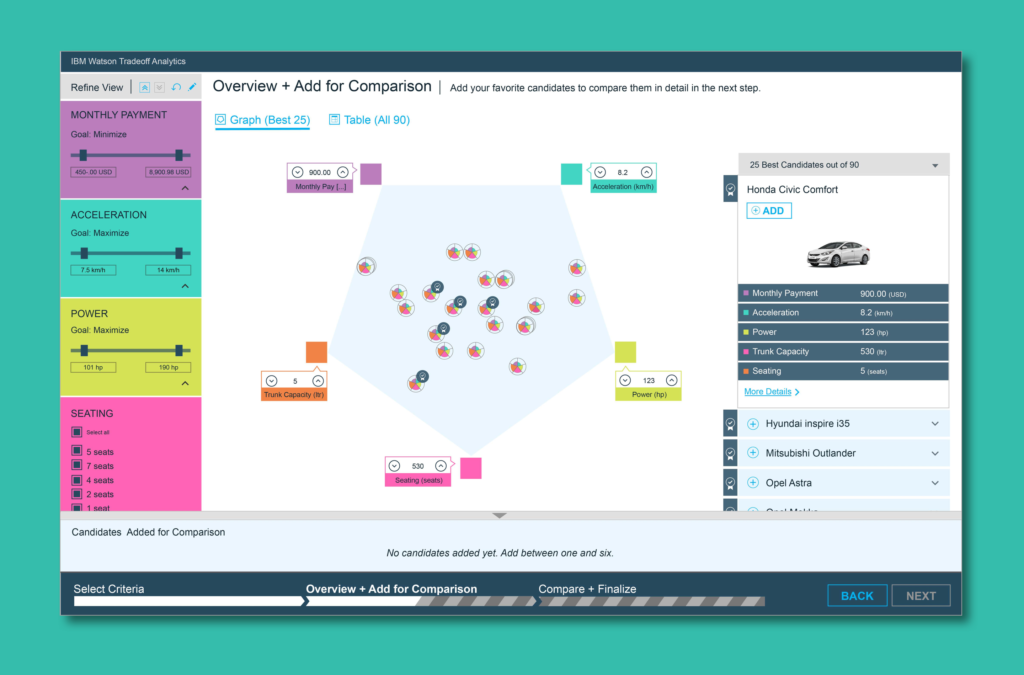
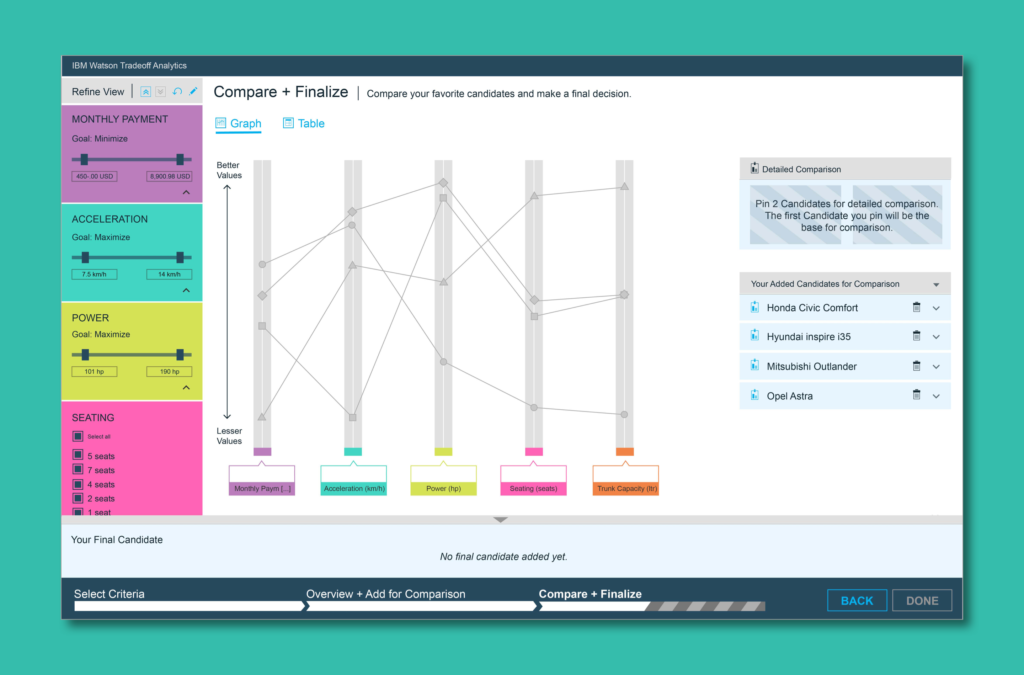
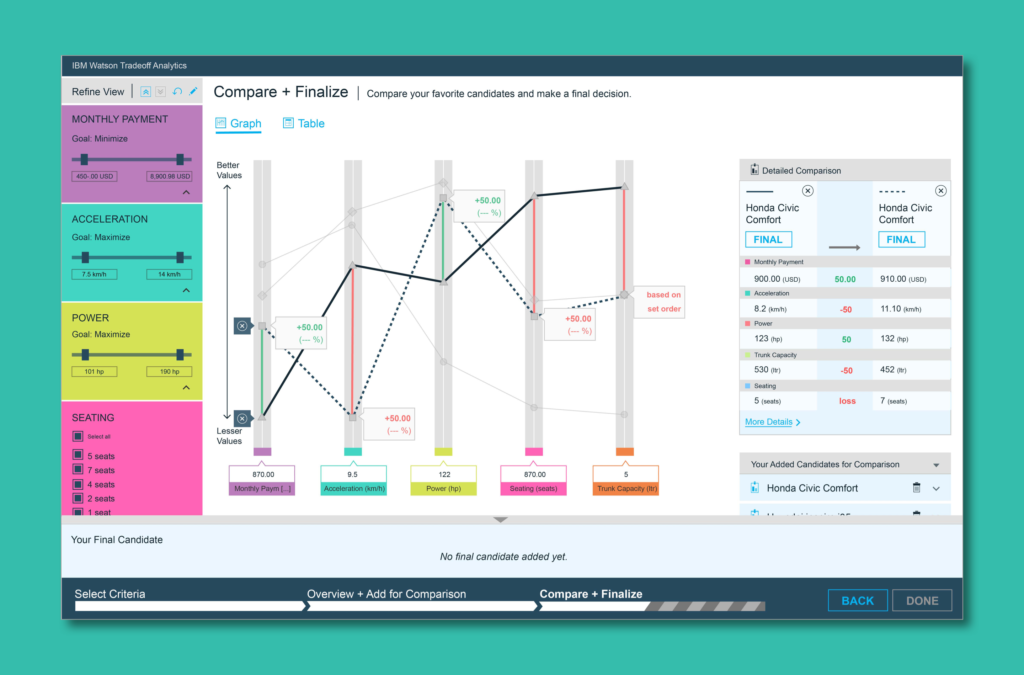
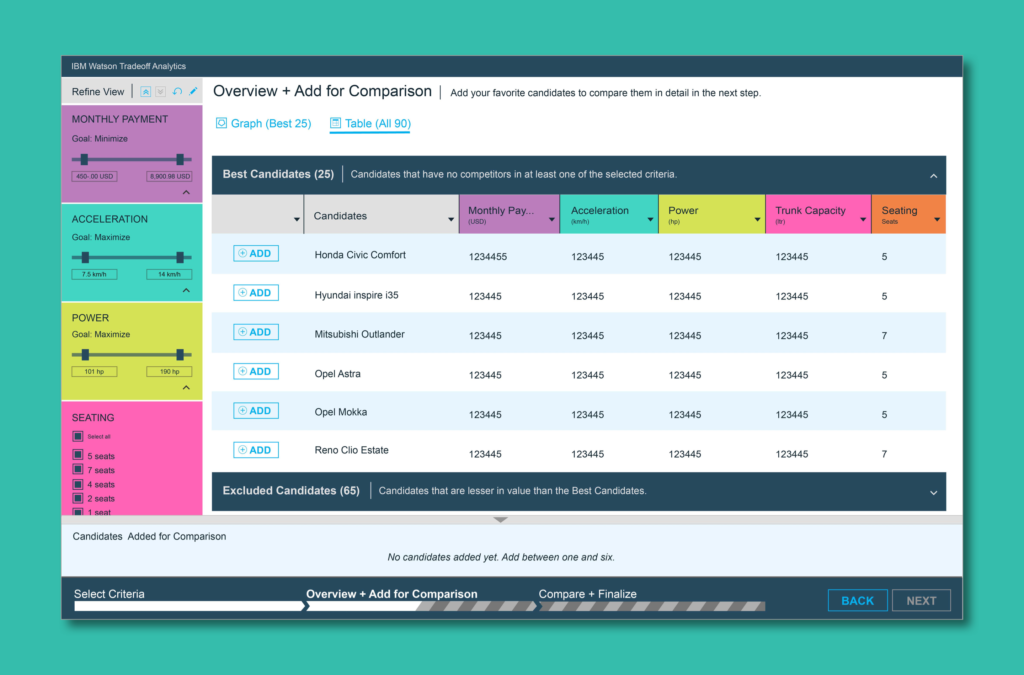
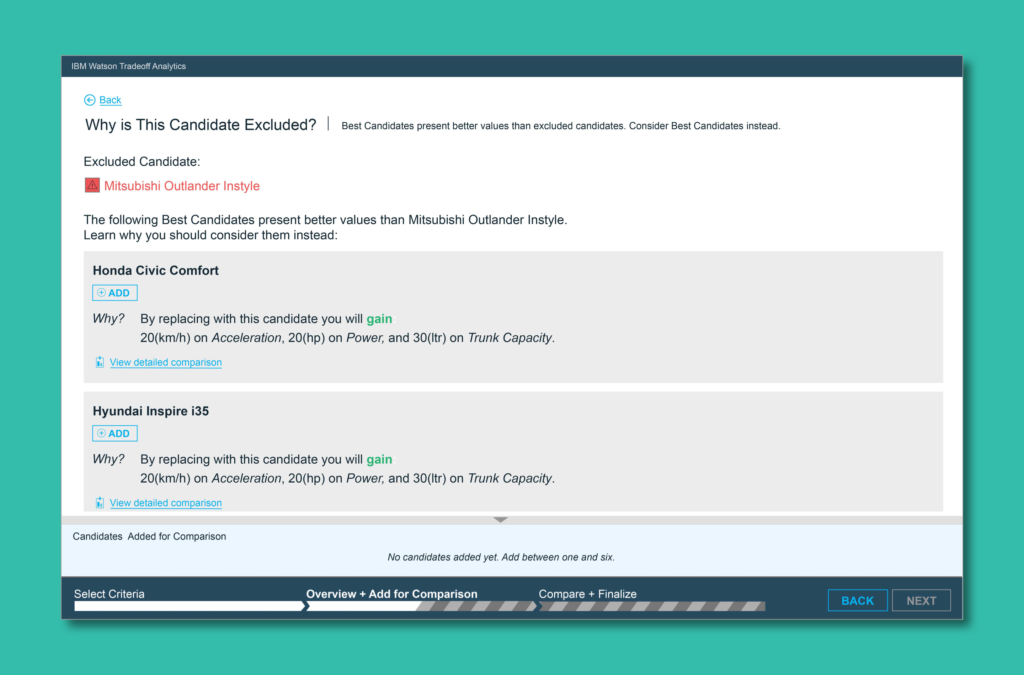
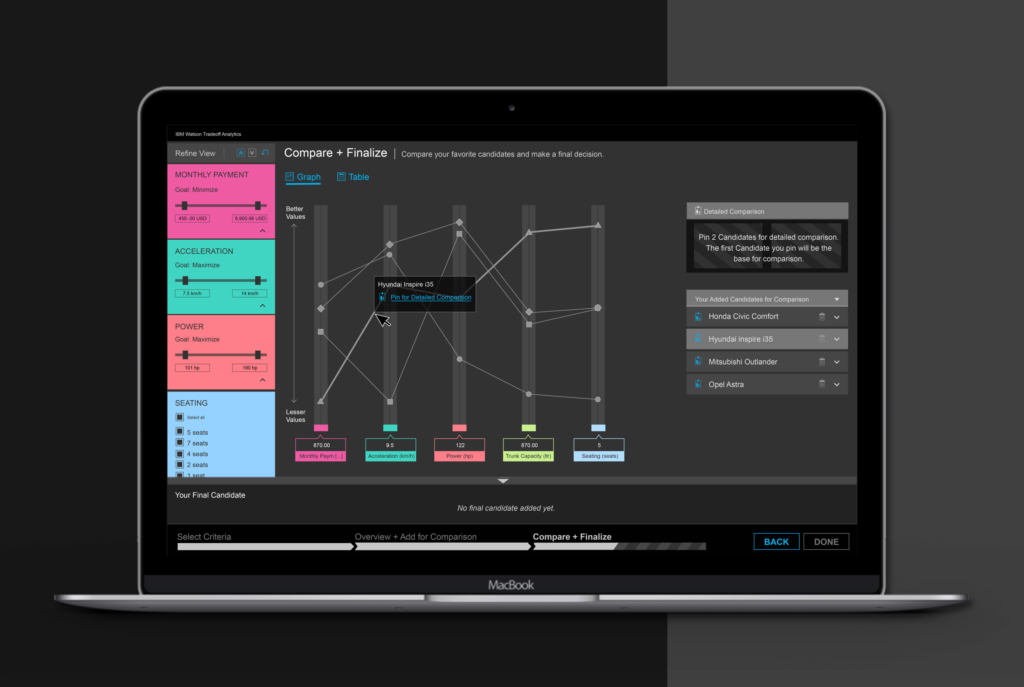
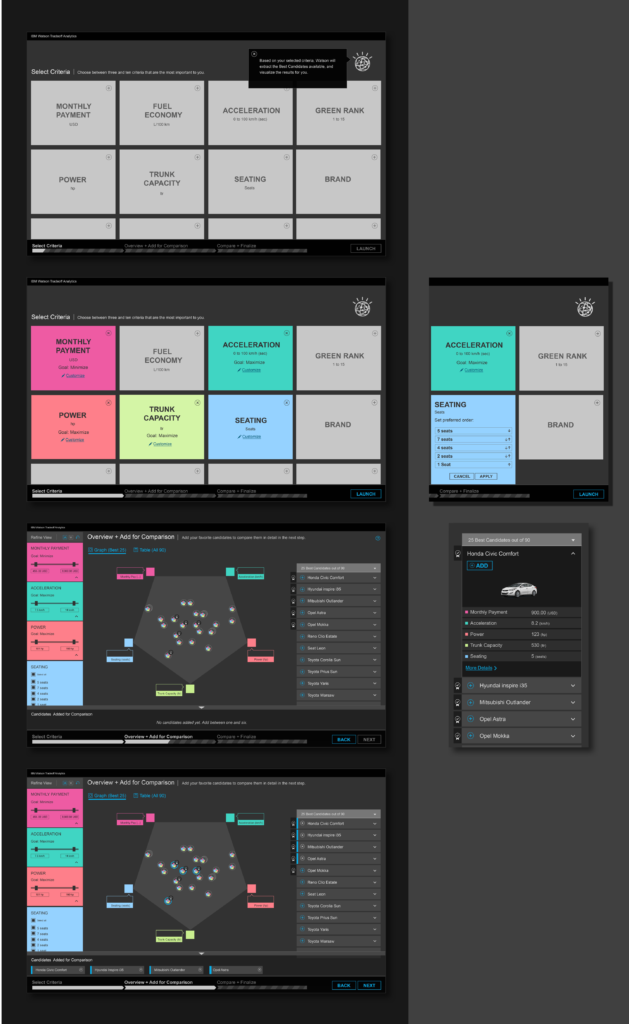
A project that started in IBM research and later became an IBM Watson service. It was meant to support users in their decision making process, highlight tradeoffs and give an in-depth visual analysis of the given choices.
After 4+ years of researchers and developers working on the tool without any design involvement, I was hired to lead the UX effort to redesign the tool. With all the challenges of educating a team of scientists about design, and getting stakeholder buy-in on the importance of design, I led the design research and usability testing, the UI and visual design, and even creating a motion graphic (below) to help simplify the core concept.
Tradeoff Analytics is now open source. To me, it represents a true learning experience as a one-woman-design-show on an all developer/scientist team. The real success story here is that the people I worked with are now advocates for usability and for integrating design at the beginning of tech innovation and never as an afterthought.
Below is a sample of the work.
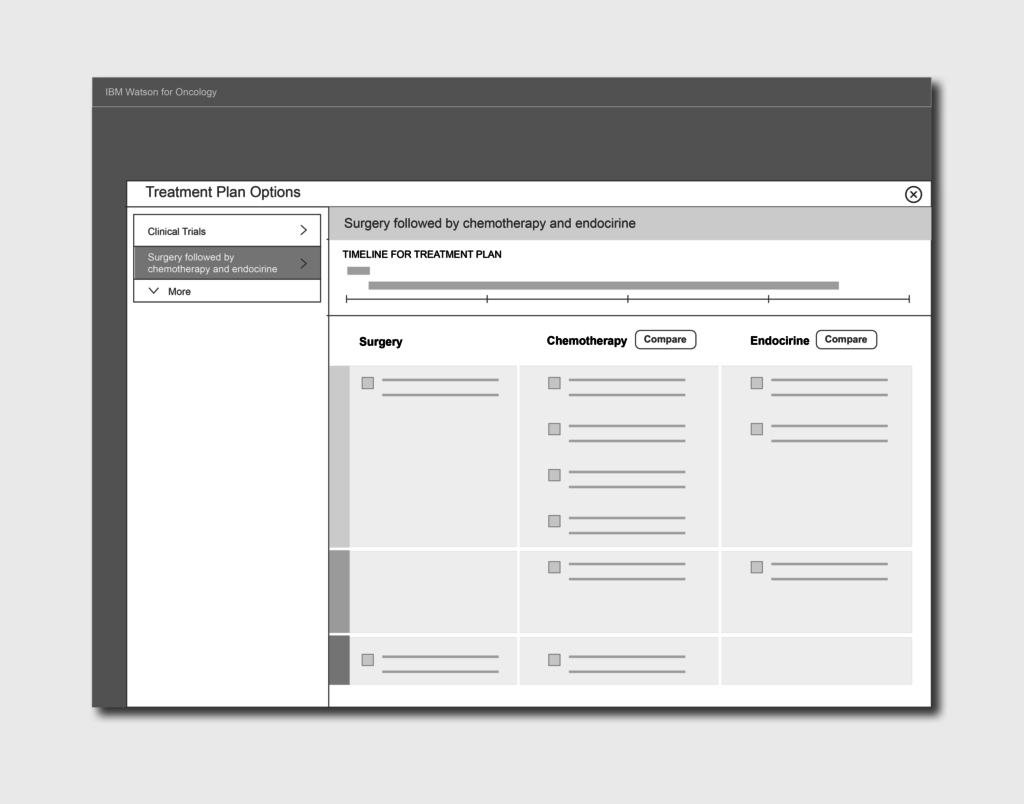
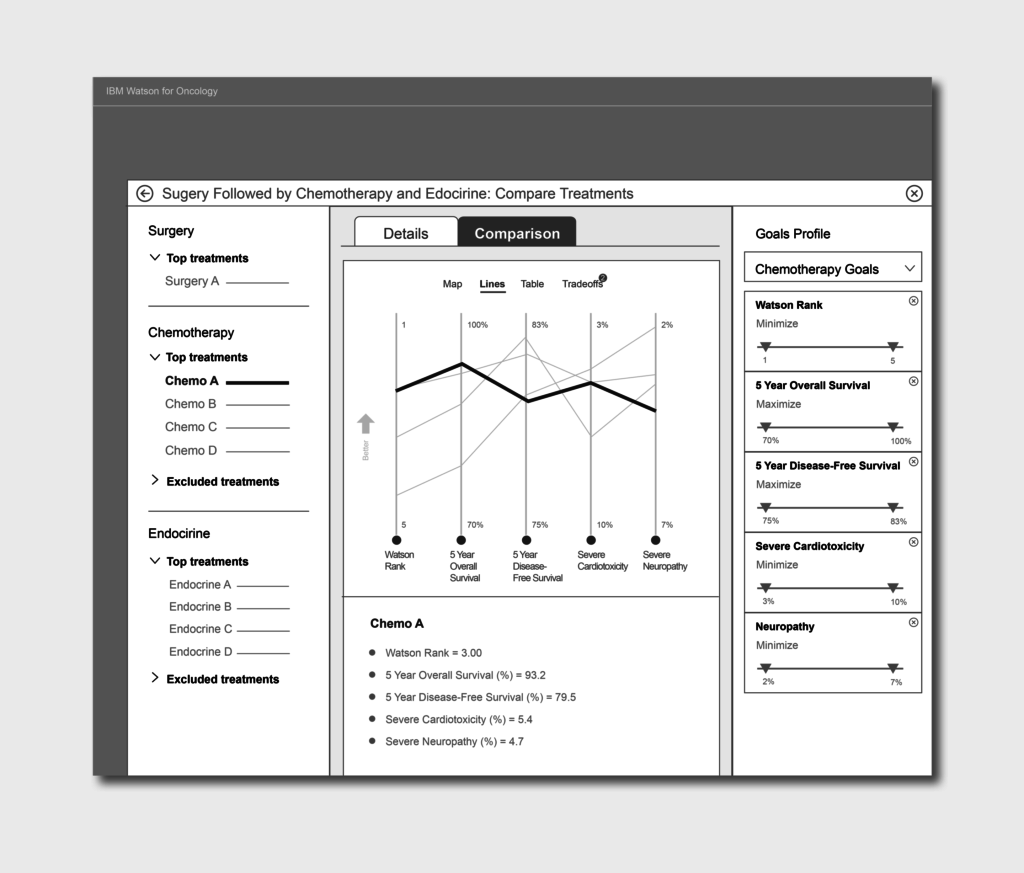
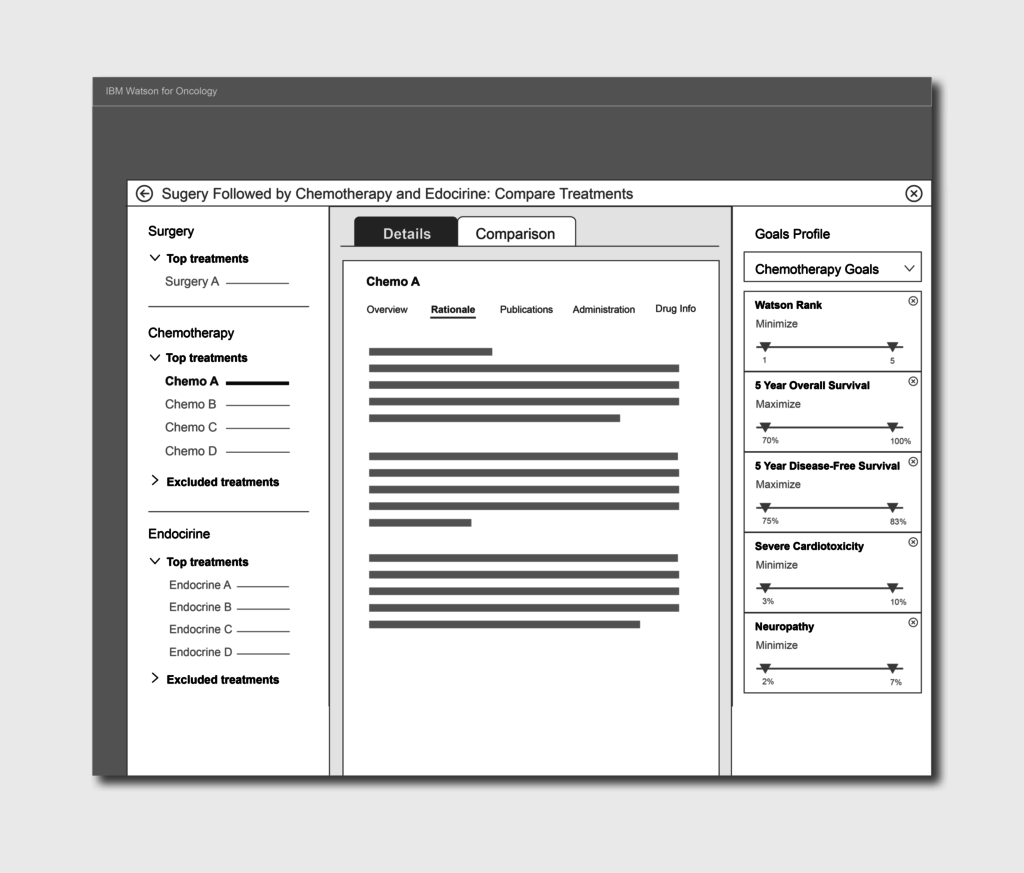
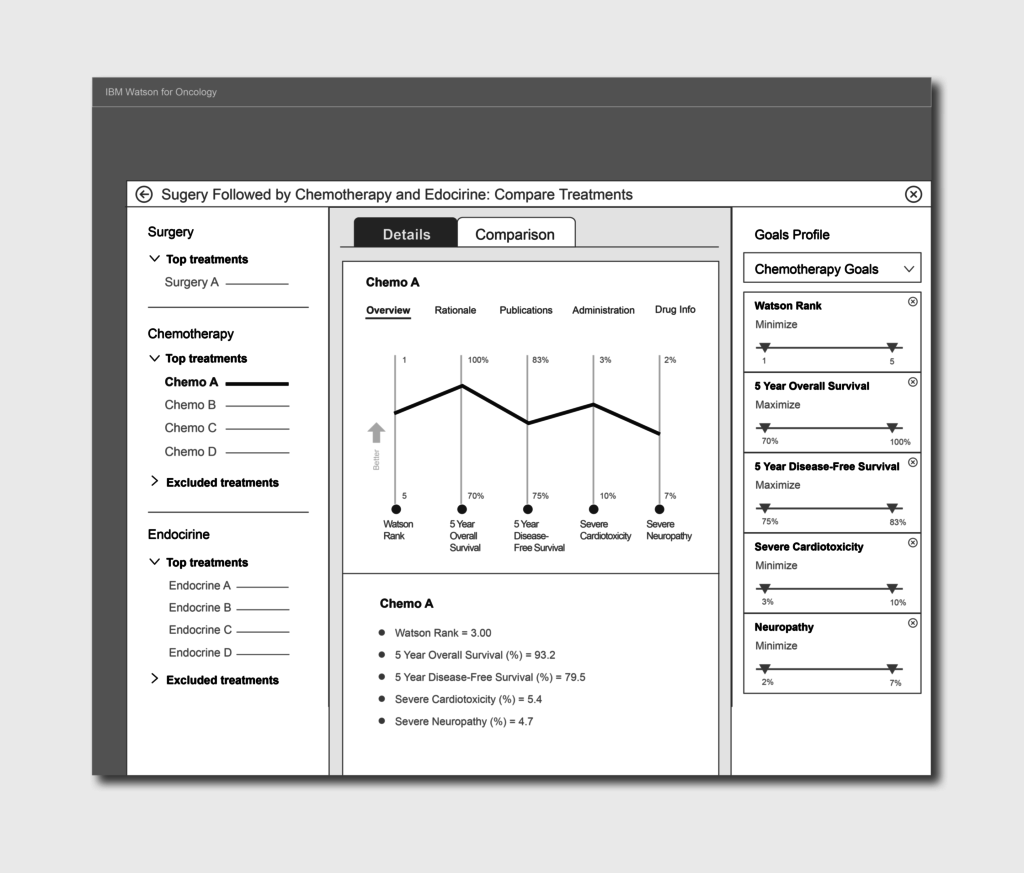
Integrating TA with Watson for Oncology
Sample wireframes from an effort to integrate the Watson Tradeoff Analytics service into a tool for Oncology to help physicians choose the best possible treatment plans for oncology patients.
Telling the Story of TA via a Motion Graphic
A creative project that I initiated to tell the story of TA. My background in illustration came in handy.
I first started with a storyboard and an outline, and got all stakeholders to review and confirm the content. I then created the illustrations in Adobe Illustrator, and the animation in Adobe After Effects. Oh, and that’s my voice over too :).